Explore the data
 Sustainable Development Report of the United States 2018 Interactive Dashboard
Sustainable Development Report of the United States 2018 Interactive Dashboard
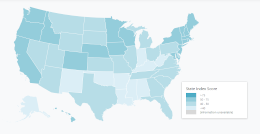
The interactive dashboard provides a visual representation of states' performance by SDGs to identify priorities for action.
Download the data
Forward
For governments at all levels (national, state, and local) around the world, the Sustainable Development Goals (SDGs) offer a set of integrated objectives to achieve prosperous, inclusive and environmentally sustainable societies, in short to achieve sustainable development. Sustainable development is the enigmatic challenge of our time. Our global economy has created great wealth and technological wonders, but it has also created societies that are deeply divided between the haves and the have-nots, and economies that are destroying the natural environment and threatening humanity even as they spur economic growth. The core idea of sustainable development is that economic growth is not enough for human wellbeing. It makes no sense to promote economic growth that hurts the poor while benefitting the rich, and that threatens the life-support systems of clean air and water, bountiful oceans, abundant biodiversity, and a safe climate.
The US is not a top performer in sustainable devel- opment. Indeed, in this year’s global ranking, the US ranks 35th overall, even though it is one of the richest countries in the world. The problem, in short, is that the US economy is heavily focused on profits at all costs, even at the costs of the poor and the costs of the natural environment. The US is not a balanced society. Life at the top is one of great riches and benefits. Life at the bottom is increasingly tough. And for nature – the air, water, soils, climate – the profit motive trumps life itself. The US has turned its back on many global environ- mental agreements, with greed taking precedence over prudence and regard for the future.
This report takes the SDGs down to the state level. It builds on cross-country analyses published each year, and an important city-level analysis published earlier in 2018. The fact is that the US varies widely across the 50 states regarding sustainable development.
New England exemplifies sustainable development, with strong rankings across the three pillars of sustainable development (economic, social, and environmental). The Pacific region also shows high performance across the three pillars. Alas, the southern regions lag far behind on all three dimensions of sustainable development. These regional differences should be a wake-up call.
The purpose of this SDG index is not to shame any state, but to call attention to the enormous gaps between what we have declared as our targets and our current stage of achievement. This report is meant to be a call to action, spurring the states to get serious in sustainable development planning and implementation. We hope that the states will use this report in the manner intended: to promote action, and to promote an exchange of best practices, especially between the states and regions currently farthest ahead and the states and regions currently farthest behind.
Jeffrey D. Sachs
Director, Sustainable Development Solutions Network
Authors
Jeffrey D. Sachs, Alainna Lynch, Anna LoPresti, and Caroline FoxAcknowledgements
The 2018 United States Sustainable Development Report compiles the data analyses and resources from many agencies, research centers, civil society organizations, and others. The authors would like to acknowledge and thank the researchers for their work and contributions that were used in producing this report. For a complete list of data sources, refer to the Bibliography section of the index. Thank you to Saloni Jain and Electa Hare Redcorn for their assistance in the production of this report. We would also like to thank Hayden Dahmm, Guillaume Lafortune, Jessica Espey and Guido Schmidt- Traub from SDSN for their input. In addition, the authors would like to thank Upmanu Lall and Naresh Devineni from the Columbia Water Center for their data support, as well as Lynn Rubinstein of the Northeast Recycling Council and Khalil Shahyd for their advice.
Design and Layout by Pica Publishing Ltd – www.pica-publishing.com