Explore the data
 SDG Index and Dashboards Report for European Cities Interactive Dashboard
SDG Index and Dashboards Report for European Cities Interactive Dashboard
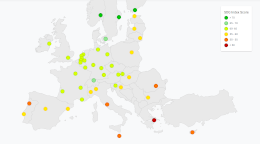
The interactive dashboard provides a visual representation of cities' performance by SDGs to identify priorities for action.
Download the data
Rankings
| Rank | City | Score |
| 1 | Oslo, Norway | 74.8 |
| 2 | Stockholm, Sweden | 74.2 |
| 3 | Helsinki, Finland | 71.3 |
| 4 | Copenhagen, Denmark | 68.7 |
| 5 | Zurich, Switzerland | 67.5 |
| 6 | Lyon, France | 64.9 |
| 7 | Paris, France | 64.7 |
| 8 | Munich, Germany | 64.2 |
| 9 | The Hague, Netherlands | 63.7 |
| 10 | Eindhoven, Netherlands | 63.5 |
| 11 | Amsterdam, Netherlands | 63.5 |
| 12 | Rotterdam, Netherlands | 63.4 |
| 13 | Luxembourg, Luxembourg | 63.0 |
| 14 | Hamburg, Germany | 63.0 |
| 15 | Bordeaux, France | 62.6 |
| 16 | Vienna, Austria | 62.5 |
| 17 | Ljubljana, Slovenia | 62.5 |
| 18 | Berlin, Germany | 62.1 |
| 19 | London, United Kingdom | 62.0 |
| 20 | Nuremburg, Germany | 61.9 |
| 21 | Antwerp, Belgium | 61.7 |
| 22 | Dublin, Ireland | 61.6 |
| 23 | Marseille, France | 61.4 |
| 24 | Frankfurt, Germany | 61.2 |
| 25 | Brussels, Belgium | 60.4 |
| 26 | Bratislava, Slovakia | 60.2 |
| 27 | Prague, Czech Republic | 60.1 |
| 28 | Madrid, Spain | 59.7 |
| 29 | Tallinn, Estonia | 59.5 |
| 30 | Barcelona, Spain | 59.1 |
| 31 | Warsaw, Poland | 57.8 |
| 32 | Zagreb, Croatia | 57.1 |
| 33 | Vilnius, Lithuania | 56.8 |
| 34 | Milan, Italy | 56.8 |
| 35 | Turin, Italy | 56.4 |
| 36 | Riga, Latvia | 56.3 |
| 37 | Budapest, Hungary | 55.4 |
| 38 | Sofia, Bulgaria | 55.2 |
| 39 | Lisbon, Portugal | 55.1 |
| 40 | Rome, Italy | 55.0 |
| 41 | Bucharest, Romania | 54.4 |
| 42 | Valletta, Malta | 53.8 |
| 43 | Nicosia, Cyprus | 53.7 |
| 44 | Porto, Portugal | 53.5 |
| 45 | Athens, Greece | 48.6 |
We are pleased to launch the 2019 SDG Index and Dashboards Report for European Cities (prototype version). This is the first report comparing the performance of capital cities and a selection of large metropolitan areas in the European-Union (EU) and European Free Trade Association (EFTA) on the 17 Sustainable Development Goals (SDGs). In total, results for 45 European cities are presented in this first prototype version. The report was prepared by a team of researchers from the Sustainable Development Solutions Network (SDSN) and the Brabant Center for Sustainable Development (Telos, Tilburg University).
It builds on SDSN’s experience in designing SDG indicators for nations and metropolitan areas. The report also builds on TELOS’ previous work on “Sustainability Monitoring of European Cities” (2014) prepared in collaboration with the European Commission’s Directorate-General for Environment (Zoeteman et al. 2014) which led to the development of an interactive platform on request of the Dutch Ministry of Interior and Kingdom Relations (Zoeteman et al. 2016)1.
This report comes at a key opportunity for Europe to increase its focus on the SDGs, with the election of the new European Parliament in May, the new Presidency of the Council of the EU moving to Finland in July, and the arrival of a new European Commission by the end of the year. The European Union can and should strengthen its policy measures to achieve all of the SDGs. In that context, the European Commission’s January 2019 Reflection Paper “Towards a sustainable Europe by 2030” highlights various scenarios to support the SDGs over the next decade. The report by the European Commission highlights the opportunities to address the SDGs as part of the next EU Urban Agenda.
Achieving the SDGs will require, at the local level, deep transformations in transportation, energy and urban planning and new approaches to address poverty and inequalities in access to key public services including health and education. The SDSN estimates that about two-thirds (65%) of the 169 SDG targets underlying the 17 SDGs can only be reached with the proper engagement of, and coordination with, local and regional governments (SDSN 2015).
Similarly, UN-Habitat estimates that around one-third of all SDGs indicators have a local or urban component2. The Urban Agenda for the European Union launched in May 2016 (Pact of Amsterdam), recognizes the crucial role of cities in achieving the SDGs. Over two-thirds of EU citizens live in urban areas while about 85% of the EU’s GDP is generated in cities (European Commission 2019). The urban population in Europe is projected to rise to just over 80% by 2050 (European Commission 2016).
This 2019 SDG Index and Dashboards for European Cities (prototype version) finds that no European capital city or large metropolitan area has of yet fully achieved the SDGs. Nordic European cities – Oslo, Stockholm, Helsinki and Copenhagen – are closest to the SDG targets but still face challenges in achieving one or several of the SDGs. Overall, the cities in Europe perform best on SDG 3 (Health and Well-Being), SDG 6 (Clean Water and Sanitation), SDG 8 (Decent Work and Economic Growth) and SDG 9 (Industry, Innovation and Infrastructure). By contrast, performance is lowest on SDG 12 (Responsible Consumption and Production), SDG 13 (Climate Action) and SDG 15 (Life on Land).
As always, our analysis is constrained by the availability, quality and comparability of data. These data constraints are even greater at the subnational level. Despite the ground breaking work conducted by the European Commission – notably via Eurostat and the Joint Research Centre – to define territorial levels and metropolitan areas and to standardize subnational data and indicators, major gaps remain to monitor all of the SDGs. A table summarizing some of these major gaps is included in this report.
The need to expand and strengthen SDG monitoring in regions and municipalities across Europe in the coming years was raised extensively in the consultation made by SDSN as part of its 2019 study on “Exposing EU policy gaps to address the Sustainable Development Goals” prepared in collaboration with the European Economic and Social Committee (Lafortune and Schmidt-Traub 2019) . This was also one of the recom- mendations made by ESAC during the consultation phase for the “2017 Sustainable development in the European Union — Monitoring report on progress towards the SDGs in an EU context” (European Statistical Advisory Committee (ESAC) 2017).
We hope this first 2019 SDG Index and Dashboards Report for European Cities (prototype version) will help to identify the major SDG priorities in urban Europe. All data and analyses included in this report are available on SDSN’s and TELOS’ data portals (www.sdgindex.org and www.telos. nl). Individual city profiles are accessible online. We very much welcome comments and suggestions for filling gaps in the data used for this index and for improving the analysis and presentation of the results. Please contact us at info@sdgindex.org or telos@uvt.nl.
Jeffrey Sachs,
Director SDSN
Geert Duijsters,
Dean Tilburg School of economics, Tilburg University - Telos
Authors
Guillaume Lafortune, Kees Zoeteman, Grayson Fuller, Rens Mulder, John Dagevos and Guido Schmidt-TraubCitation
Guillaume Lafortune, Kees Zoeteman, Grayson Fuller, Rens Mulder, John Dagevos and Guido Schmidt-Traub. (2019). The 2019 SDG Index and Dashboards Report for European Cities (prototype version). Sustainable Development Solutions Network (SDSN) and the Brabant Center for Sustainable Development (Telos).
Acknowledgements
The report was prepared by teams of independent experts at the SDSN Secretariat and TELOS. Lead writers at SDSN include Guillaume Lafortune and Grayson Fuller under the direction of Guido Schmidt-Traub. Lead writers at TELOS include Kees Zoeteman, Rens Mulder and John Dagevos. The views expressed in this report do not reflect the views of any organizations, agencies or programmes of the United Nations. Additionally, they may not reflect the opinions of SDSN’s Leadership Council members and their host institutions.
The report compiles the results from data collection and analyses produced by various European and non-European institutions. These include the European Commission via Eurostat, the European Environment Agency, the European Energy Agency, the Joint-Research Centre (JRC) and the Organisation for Economic Co-operation and Development (OECD). We are grateful to the Joint Research Centre and the OECD for their comments and technical feedback on the indicator selection.
We also thank Jorge Moreno Membrillera (SDSN) for his excellent research assistance and Liara Fair Mehring (SDSN) for editorial assistance.