 In the Red: the US Failure to Deliver on a Promise of Racial Equality Explore data: the US failure to deliver on a promise of racial equality in our interactive dashboards
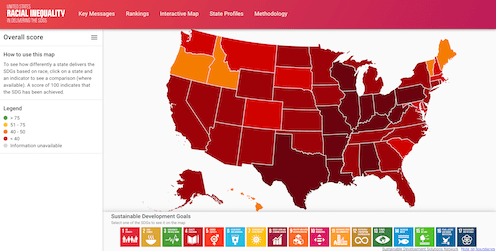
To see how differently a state delivers the SDGs based on race, click on a state and an indicator to see a comparison (where available). A score of 100 indicates that the SDG has been achieved.
Rankings
| Rank | State | Score |
| 1 | Hawaii | 45.6 |
| 2 | Oregon | 43.07 |
| 3 | Idaho | 42.21 |
| 4 | Vermont | 41.5 |
| 5 | Maine | 40.4 |
| 6 | New Hampshire | 39.92 |
| 7 | Washington | 37.62 |
| 8 | Colorado | 37.05 |
| 9 | Montana | 36.59 |
| 10 | Massachusetts | 36.46 |
| 11 | South Dakota | 35.58 |
| 12 | South Carolina | 35.25 |
| 13 | California | 35.02 |
| 14 | Maryland | 35.01 |
| 15 | Minnesota | 34.32 |
| 16 | Wyoming | 34.09 |
| 17 | Nebraska | 33.67 |
| 18 | Alaska | 33.29 |
| 19 | Connecticut | 33.26 |
| 20 | Arizona | 33.07 |
| 21 | New Mexico | 32.93 |
| 22 | New York | 32.91 |
| 23 | North Carolina | 32.79 |
| 24 | Iowa | 32.71 |
| 25 | Nevada | 32.68 |
| 26 | Rhode Island | 32.57 |
| 27 | Utah | 32.47 |
| 28 | Kansas | 32.23 |
| 29 | Tennessee | 32.13 |
| 30 | Virginia | 31.99 |
| 31 | Georgia | 31.98 |
| 32 | Florida | 31.97 |
| 33 | Oklahoma | 31.86 |
| 34 | Michigan | 31.36 |
| 35 | Delaware | 31.31 |
| 36 | New Jersey | 31.2 |
| 37 | North Dakota | 30.91 |
| 38 | Mississippi | 30.88 |
| 39 | Texas | 29.76 |
| 40 | Kentucky | 29.48 |
| 41 | Arkansas | 28.29 |
| 42 | Wisconsin | 28.24 |
| 43 | Missouri | 27.83 |
| 44 | Alabama | 27.82 |
| 45 | West Virginia | 27.59 |
| 46 | Ohio | 26.61 |
| 47 | Illinois | 26.27 |
| 48 | Louisiana | 25.64 |
| 49 | Pennsylvania | 24.05 |
| 50 | Indiana | 20.75 |
Unfulfilled Promise of Racial Equality
US states unequally distribute resources, services, and opportunities by race
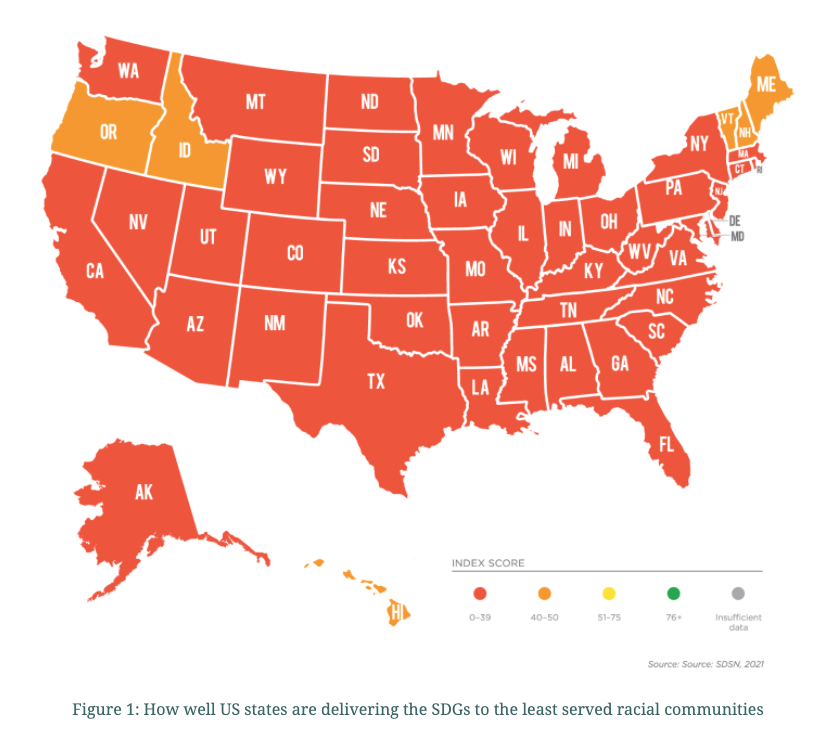
The US is failing to deliver on its promise of racial equality. While the US founding documents assert that ‘all men are created equal,’ this value is not demonstrated in outcomes across areas as diverse and varied as education, justice, health, gender, and pollution. On average, white communities receive resources and services at a rate approximately three times higher, than the least-served racial community (data on Asian, Black, Indigenous, Hawaiian and Pacific Islander, Hispanic, Multiracial and ‘Other’ racial communities, were used as available). Evidence shows that unequal treatment impacts each of these communities, however, it is most often Black and Indigenous communities that are left the furthest behind. When states are scored on how well they deliver the United Nations Sustainable Development Goals (SDGs) to the racial group least served, no state is even halfway to achieving the SDGs by 2030 (see Figure 1). To learn more about the Sustainable Development Goals, see the section “SDGs & Accountability.”
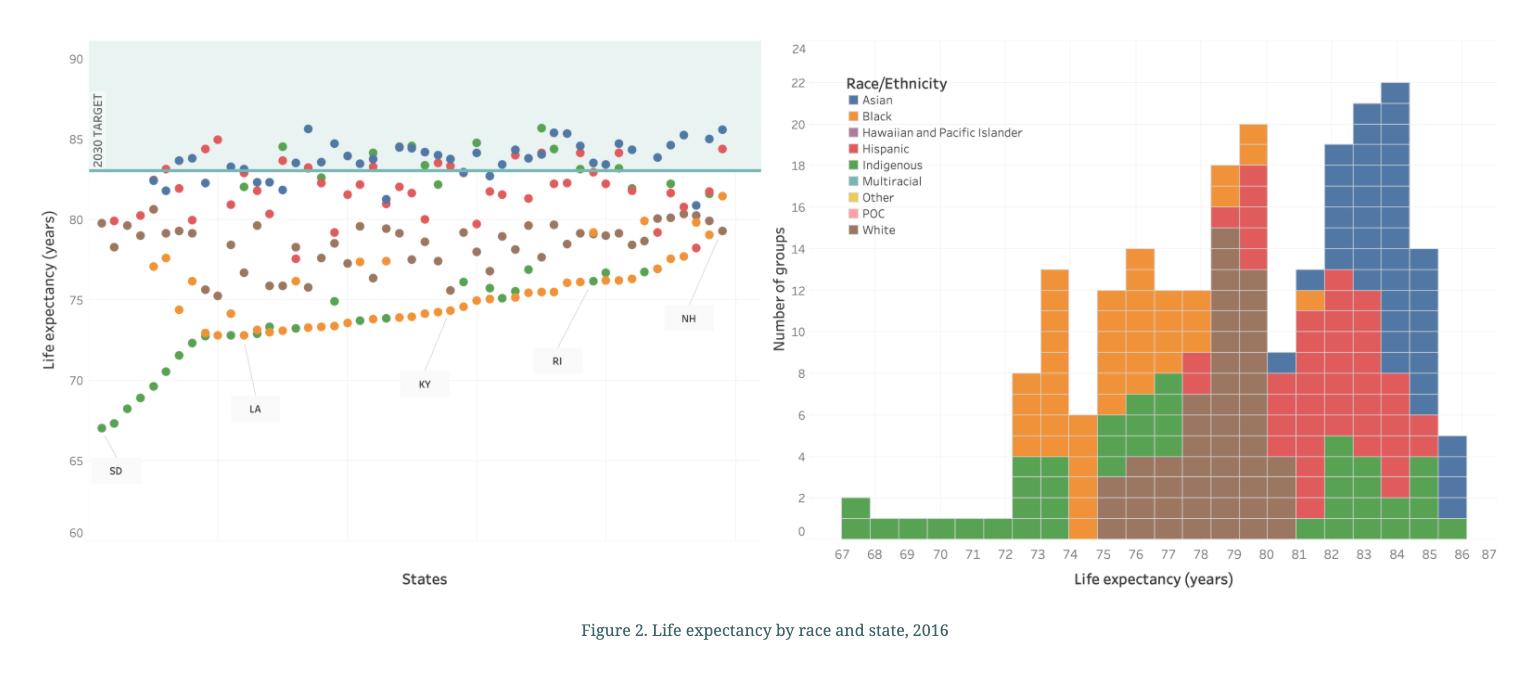
One example of this inequality is in life expectancy. In Figure 2, the scatter plot on the left demonstrates a pattern in which Black and Indigenous communities, represented by orange and green dots closest to the bottom of the graph, are consistently the communities with least access to years of life. In the graph on the right, each box represents a racial population in a specific state, the boxes are organized from left to right, lowest to highest, according to the life expectancy for that group and state. The graph shows how large the gap is in life expectancy across racial communities and states, with green and orange boxes, representing Indigenous and Black communities respectively, clustered to the left of the graph.
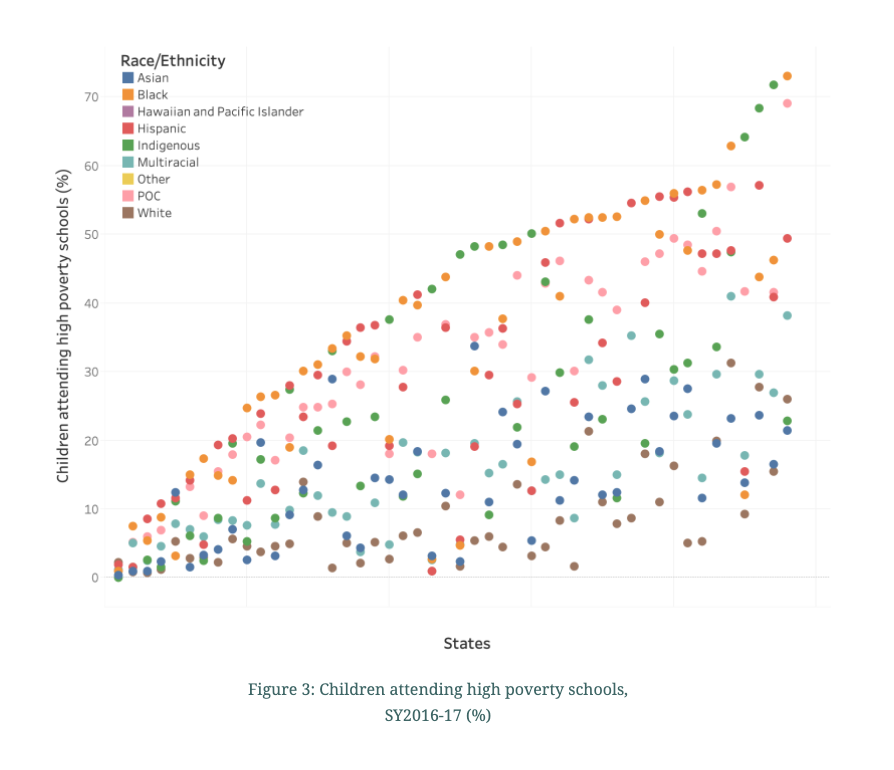
Patterns like this one, demonstrating both deep and wide racial inequalities, occur across the 51 indicators this analysis includes, covering 12 of 17 SDGs. In a similar example (Figure 3), a pattern emerges where white students are least likely to attend a school where 75 percent or more of its students receive free or reduced cost lunch when compared to all other racial groups. In the most unequal state, North Dakota, Indigenous students attend high poverty schools at a rate 42 times higher than white students. As Figure 3 shows, although the percentage of students from the least served racial group attending high poverty schools ranges from 2 percent in Vermont to 73 percent in Mississippi, the group least served, represented by the dots closest to the top of the graph, are most often Hispanic and Indigenous communities.
Lack of Racial Data
More, and better, racially and ethnically disaggregated data are needed to assess delivery of racial equality
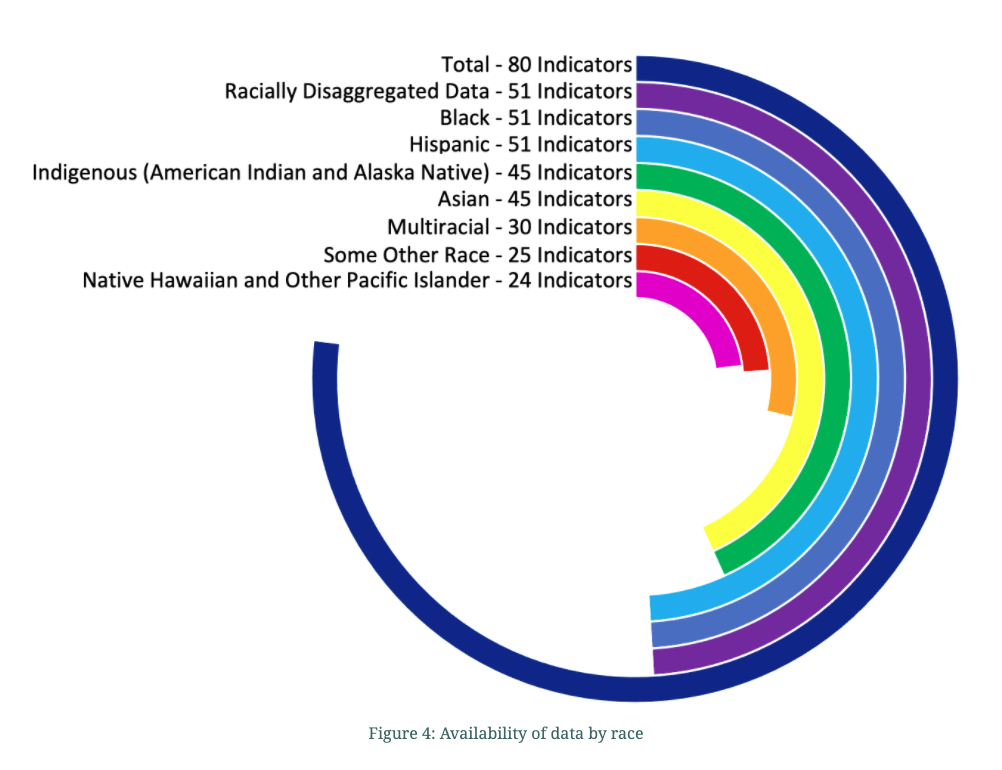
A significant barrier to evaluating progress is the unavailability of racial data across all areas of measurement. For too many important topic areas, such as food insecurity, maternal mortality and lead in drinking water, there is no racial data available at the state level. Even in the areas where there is some racial data, it is often not available for all groups (see Figure 4). Particularly missing, were measures of environmental justice; in Goals focusing on Water, Clean Energy, and Life on Land (Goals 6, 7, and 15), racial data was not found for any indicators, despite the fact that there is research indicating that clean water, for example, is unequally distributed across racial groups. The reasons for these gaps vary. For some indicators, data is not tracked through a nationally organized database, for other indicators, the data is old and out of date, and in many cases, surveys are not large enough to disaggregate by race. As was made clear with the disparate impacts of COVID-19 (for example, see CDC 2020), understanding to whom resources are being distributed has real life implications and is an important part of holding democratic institutions accountable to promises of equality.
People are often left behind due to a combination of intersecting identities and factors; they remain hidden in averages. Evaluating the Leave No One Behind Agenda through the lens of gender, ability, class and other identities are undoubtedly important and urgent. Disaggregating data along two axes such as race and location—is revealing. But an even more refined analysis using multilevel disaggregation, such as looking at women and race in urban settings, would likely reveal even starker inequalities. Those are not included here and are important areas for future work. Other areas for further exploration include the use of longitudinal data to understand how these inequalities are changing over time.
Though the full extent of this unequal treatment is unknown, this analysis sheds some light on the clouded story told by state averages. Whole group averages leave out important information, particularly about inequality. Racially disaggregated data is essential for holding governments accountable to the promise of racial equity. Without it, it is too easy to hide who is being excluded and left behind.
SDGs and Accountability
SDGs and Accountability
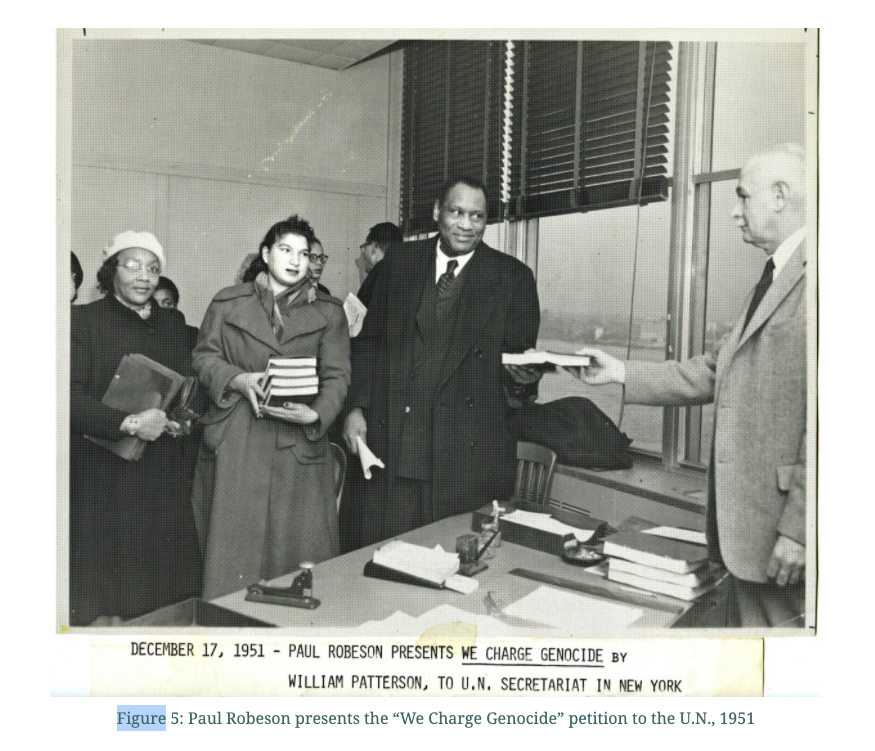
The SDGs can be an accountability tool to address racial inequality. This would not be the first time UN frameworks have been used to call attention to racial inequality in the US. In 1951, the Civil Rights Congress (CRC) led by William L. Patterson and Paul Robeson put a petition to the UN, named: “We Charge Genocide,” which charged that the United States government was in violation of the Charter of the United Nations and the Convention on the Prevention and Punishment of the Crime of Genocide (Figure 5). While this attempt did not succeed in charging the US government with genocide, it is a central example of how international instruments can be used to apply localized pressure to advance civil rights.
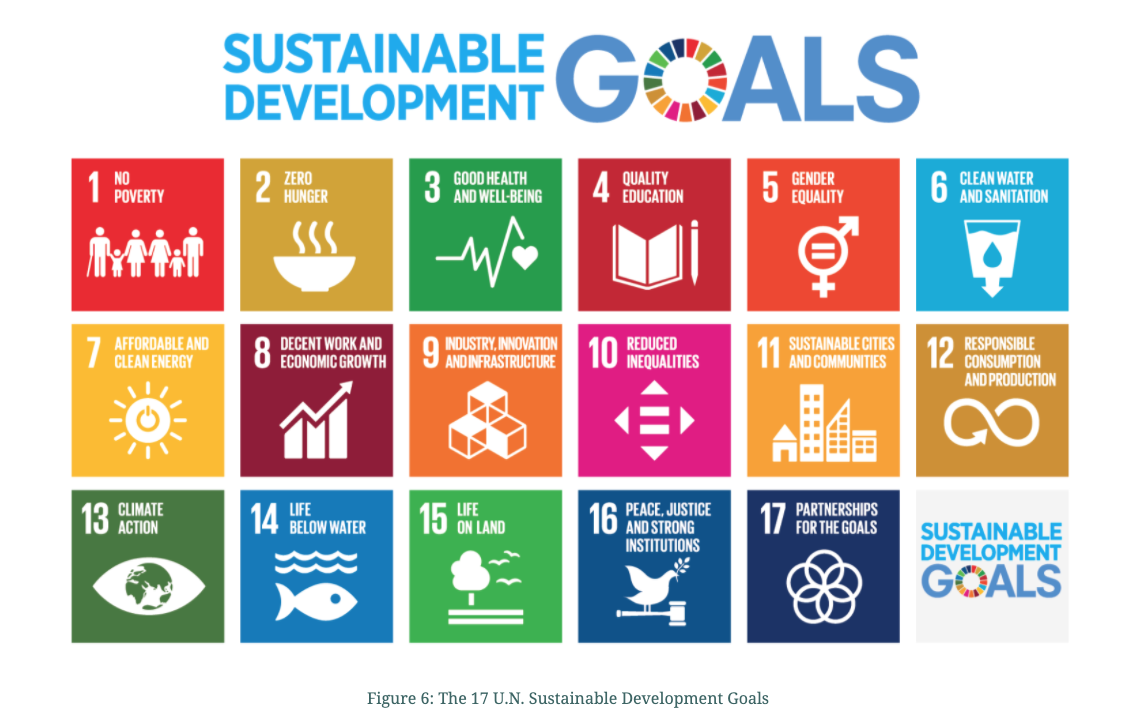
All 193 member countries of the UN, including the United States, signed on to the Sustainable Development Goals in 2015, to be achieved by 2030. The Goals cover 17 wide-ranging topics, with 169 specific targets for action (Figure 6). The first agenda of the SDGs, the Leave No One Behind Agenda (LNOB), requires that those left furthest behind by governments must have the SDGs delivered to them first. The results of this project demonstrate that in a US-context, those left furthest behind would undoubtedly include Asian, Black, Indigenous, Hawaiian and Pacific Islander, Hispanic, Multiracial and ‘Other’ racial communities. The SDGs can offer a template for US states attempting to deliver on their promise of racial equality. The broad topic areas covered by the SDGs, in combination with the Leave No One Behind agenda, can be a tool to hold states accountable for addressing racial inequalities when and through developing solutions for clean water, quality education, ending hunger, delivering justice and more. This highlights an important implication of the Leave No One Behind Agenda, it is not meant to pit communities against each other, but rather to remind us how much everyone has to gain by building and advocating for sustainable communities that serve us all.
Explore Results
Explore the data from the In the Red: the US failure to deliver on a promise of racial equality in our interactive dashboards.
These maps display how US states are delivering sustainability across different racial and ethnic groups. As part of the Leave No One Behind Agenda, which maintains that those who have been least served by development progress must be those first addressed through the SDGs, progress toward the goals in each state is displayed based on the racial group with the least access to resources, programs, and services in that state. In other words, the “Overall scores’’ map shows the score for the racial group least served in each state. Click on a state to toggle through the state’s performance by different SDGs, and click on an indicator to view how a state performs on a given indicator. At the indicator level, horizontal bar charts show the racial disparity in the selected indicator and state, when data is available.
About
In the Red: the US Failure to Deliver on a Promise of Racial Equality
In the Red: the US Failure to Deliver on a Promise of Racial Equality project highlights measurable gaps in how states deliver sustainability to different racial groups. The full report can be read here. It extends an earlier report, Never More Urgent, looking at policies and practices that have led to the inequalities described in this project. It was prepared by a group of independent experts at SDSN and Howard University.
UN Sustainable Development Solutions Network (SDSN)
The UN Sustainable Development Solutions Network (SDSN) mobilizes scientific and technical expertise from academia, civil society, and the private sector to support practical problem solving for sustainable development at local, national, and global scales. The SDSN has been operating since 2012 under the auspices of the UN Secretary-General Antonio Guterres. The SDSN is building national and regional networks of knowledge institutions, solution-focused thematic networks, and the SDG Academy, an online university for sustainable development.
SDSN USA
SDSN USA is a network of 150+ research institutions across the United States and unincorporated territories. The network builds pathways toward achievement of the UN Sustainable Development Goals (SDGs) in the United States by mobilizing research, outreach, collective action, and global cooperation. SDSN USA is one of more than 40 national and regional SDSN networks globally. It is hosted by the UN Sustainable Development Solutions Network (SDSN) in New York City, and is chaired by Professors Jeffrey Sachs (Columbia University), Helen Bond (Howard University), Dan Esty (Yale University), and Gordon McCord (UC San Diego).
Citation
Lynch, A., Bond, H., Sachs, J. 2021. In the Red: The US Failure to Deliver on a Promise of Racial Inequality. New York: SDSN