Stronger Leadership From Rich Countries Needed To Achieve The Goals
The Bertelsmann Stiftung and the Sustainable Development Solutions Network are releasing today the 2018 SDG Index and Dashboards Report, which tracks data on how all 193 UN member states are progressing towards the 17 Sustainable Development Goals (SDGs). This year the report focuses on actions taken by G20 governments to implement the goals. We also present trends data to determine which countries are currently on track to meet which SDG. In this blog we focus on challenges in rich countries.
By Guillaume Lafortune, Guido Schmidt-Traub and Grayson Fuller
This year, three Nordic countries, Sweden, Denmark, and Finland, top the global SDG Index ranking, yet all three still face major challenges in achieving the SDGs. Sweden, for example, scores red on sustainable consumption and production as well as greenhouse gas emissions. As the trends data show, the country is making progress towards achieving the goals, but it’s not on track to meet the climate SDG 13 or to make land-use and food systems sustainable (Goals 2 and 14).
Many rich countries perform poorly on several measures of “leave no one behind”, which we include for the first time in the SDG Index. Examples include measures of income and regional disparities in health care (SDG 3) or learning outcomes (SDG 4). The effect of including such equity measures is shown in Fig. 2: OECD countries’ performance weakens across the board. Even the richest countries need to focus on leave no one behind. Unfortunately, such comparable data are not available for non-OECD countries. This is another illustration of the urgent need to boost investments in data systems.
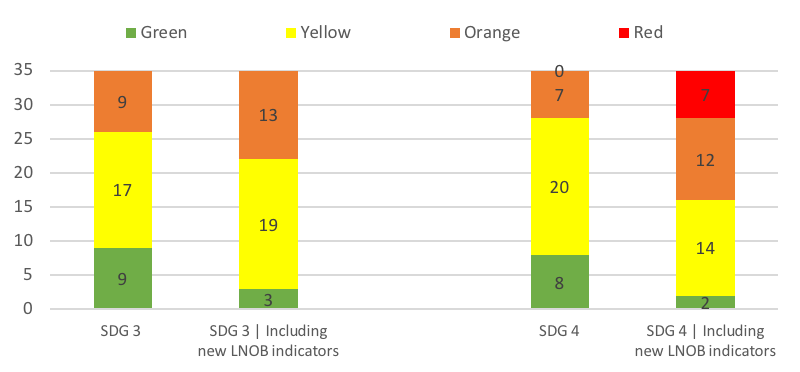
Fig 2. The inclusion of new equity measures to capture the “Leave-no-one-behind agenda” affects negatively the performance of OECD countries on the 2018 SDG dashboards.** Difference in dashboards’ color of the 35 OECD countries for SDG 3 (good health and well-being) and SDG 4 (quality education) when excluding and including new equity measures.
Note: Green : SDG achieved; Yellow: Challenges remain; Orange: Significant challenge remain; Red: Major challenges remain. For health, new LNOB measures include Gap in life expectancy by regions and gap in self-reported health by income level. For education, they include the variation in performance in student performance by socio economic background, resilient students and the share of student below level 2 in PISA science score. Source: Authors’ analysis based on Sachs and al. 2018." %}
Rich countries also generate large negative spillover effects that undermine other countries’ efforts to achieve the SDGs. For example, weapons exports, tax heavens and environmental damages embodied into trade flows (such as water depletion or CO2 emissions) have detrimental impacts on other countries’ security, economic situation and environmental outcomes. The inclusion of spillover indicators considerably reduces the SDG Index score of some rich countries (fig 3), but with large variation. The difference is greatest for the UK and the United States, which Japan and Canada manage to combine high domestic SDG performance with low spillover effects.
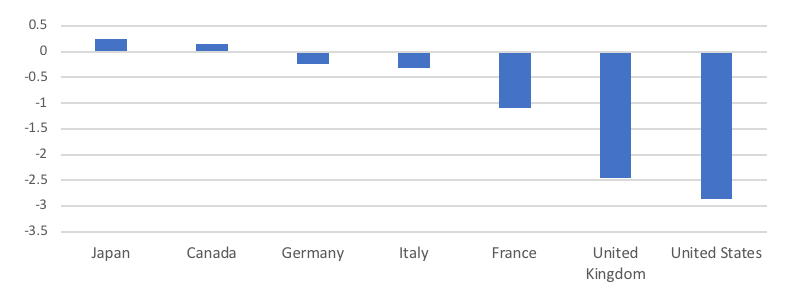
Fig 3. The inclusion of spillover metrics affects negatively the SDG Index Score of most G7 countries
Difference in total SDG Index score due to the inclusion of spillover indicators, G7 countries, in percentage points, 2018. Source: Authors’ calculations based on Sachs and al. 2018." %}
The report also presents the first and highly preliminary assessment of G20 government commitments to achieve the SDGs. Our survey results show that almost all G20 countries have undertaken some efforts to implement the SDGs, but all fall short on important dimensions, such as government accountability mechanisms, public management practices, and budgeting. Brazil, Mexico and Italy demonstrate relatively high levels of institutionalization, while the USA and the Russian Federation perform worst (fig 4).
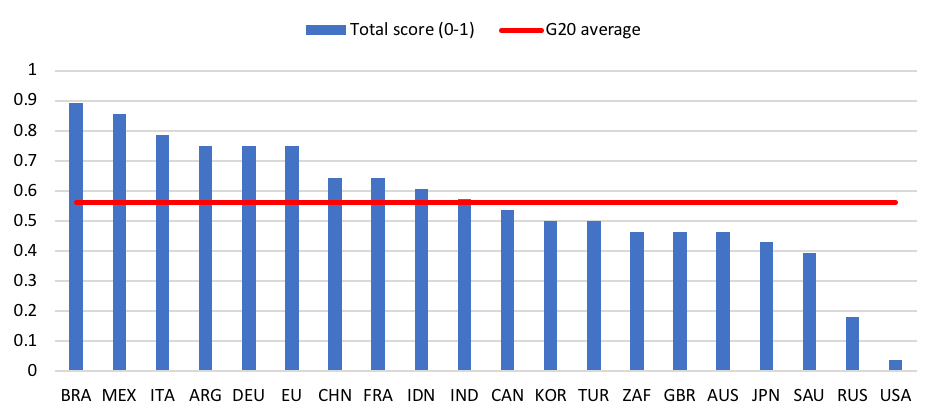
Fig. 4. The first comparative assessments of governments’ efforts to implement the SDGs shows major disparities
National coordination and implementation mechanisms for the SDGs in G20 countries, 2018. Composite score from 0 (lowest) to 1 (highest). Source: Sachs and al, 2018." %}
Our report demonstrates the usefulness of the SDGs as a scorecard for sustainable development in rich and poor countries alike. No country is on track to achieving all goals, and all will need to transform education, health, energy systems, land-use, urban development, and many other dimensions. While some steps have been taken in the right direction far more is needed, particularly from rich countries.
We hope the data and visuals available in this year’s report help national discussions on implementation priorities and ways to achieve the goals. The full report, detailed country profiles, and all data are available online at www.sgdindex.org. We plan to improve the methodology for this first assessment of government progress and extend it to more countries. We welcome suggestions for how to improve the analysis.