Behind the numbers: Joint Research Centre Audit of the SDG Index and Dashboards
By Eleni Papadimitriou, Ana Rita Neves and William Becker, European Commission’s Joint Research Centre
Indexes are powerful policy, advocacy and formulation tools. Where multidimensional concepts such as sustainable development cannot be captured by a single indicator alone, an index is able to synthesize large and complex data sets into a single measure. It can provide a big picture view and be an effective means to stimulate public debate and policy discussions.
However, the process of building an index is not straightforward, and faces many conceptual and methodological challenges. In order to help index developers in improving the reliability and transparency of their indexes, the European Commission’s Competence Centre on Composite Indicators and Scoreboards (COIN) at the Joint Research Centre (JRC) in Italy, carries out statistical audits of indexes upon request of international organizations and other European Commission services. To date, over 100 indexes, in a variety of policy domains, have received tailored recommendations from our research team at the JRC.
In 2018, the Sustainable Development Solutions Network (SDSN) reached out to the JRC to assess and audit the Sustainable Development Goals (SDG) Index. The SDSN team wanted to ensure that the index is technically sound, in order to derive accurate and meaningful results for policymakers and advocates. After several of rounds of discussion, with suggestions for improvements in terms of data characteristics, structure and methods used, the index was launched.
The JRC statistical audit of the 2019 edition of the SDG Index focused on two main issues: the statistical coherence of the structure of indicators and the impact of key modeling assumptions on the SDG Index ranking.
The uncertainty and sensitivity analyses carried out confirm that the uncertainty is manageable and allows meaningful conclusions to be drawn from the SDG Index. Nevertheless, both the aggregation method and the set of indicators do cause a modest contribution to the uncertainty. A suggestion would be to guide the conclusions that can be drawn from the SDG Index using the following information: differences of two or three places between countries cannot be taken as “significant”, whereas differences of 10 places can show a meaningful difference.
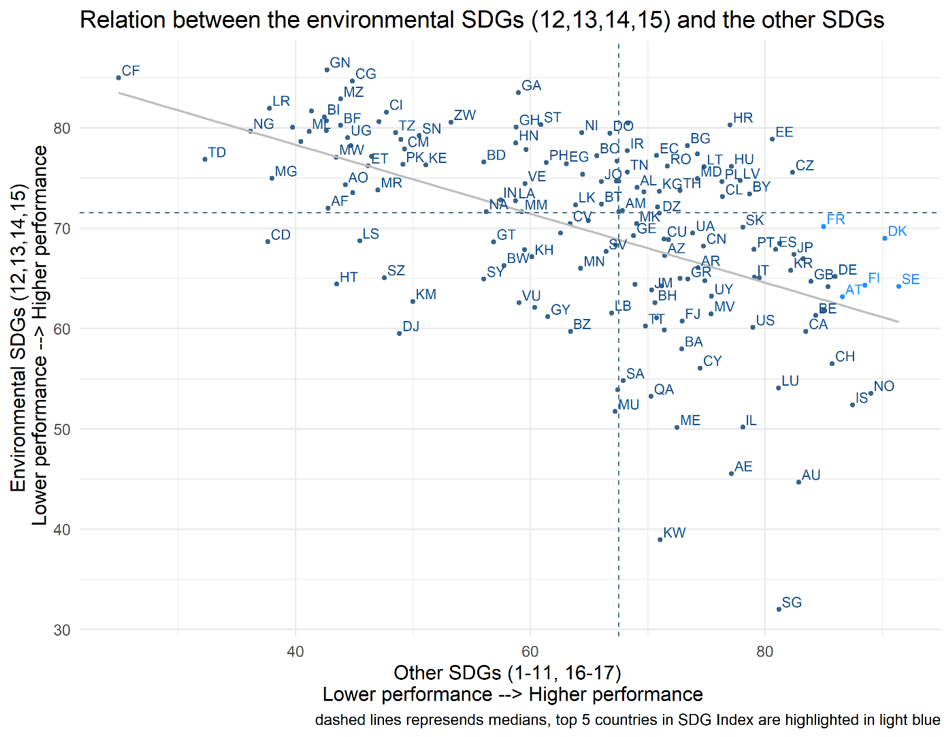
The audit identified that the main challenge on the construction of the SDG Index lays on the inverse relationship between socio-economic and environmental goals, in particular SDG12 (responsible consumption and production) and SDG13 (climate action). Also, SDG14 (life below water) and SDG15 (life on land) show no significant association with the SDG Index, meaning that the SDG index scores are not generally representative of these two goals. The negative relationship between goals is a sign of a trade-off, whereby some countries that have poor performance on SDG12 and SDG13 have good performance on all the other goals, and vice-versa. This suggests that an analysis of the underlying goals, which can reveal these trade-offs, should complement the overall index scores.
Plotting the environmental SDGs (12, 13, 14 and 15), which present a negative or insignificant association with the overall index against all the other SDGs, shows that the top five countries of the SDG Index are actually ranked well below many other countries with lower performance on the SDG Index. Denmark, which tops the list on the SDG Index, is in 143rd position for SDG12. In the other direction, the Central African Republic, which is at the bottom of the SDG Index, holds the second best position on SDG13.

The SDG Index is a noteworthy and much-needed tool which synthesizes the 17 adopted SDGs into a single measure. Overall, the ranks of the SDG Index are fairly robust. The index rigorously follows the same structure of 17 goals of the 2030 Agenda for Sustainable Development. The fact that the goals are universal and highly diverse in nature makes the work of aggregating into a single number quite challenging from a statistical point of view. However, the index is complemented by dashboards, which are a very communicative and neat way to show the performance of countries at individual goal level, and help to convey the information that is left out of the overall index.
The SDG Index proposes a first-of-its-kind composite measure to track progress on SDGs at national and global level, but it is fundamental that communication of its results is accompanied by a deep understanding of its underlying components and the relationships between them.
We expect the SDG Index to be an inspirational tool for action and to contribute to the growing momentum towards the implementation of the 2030 Agenda 2030 for Sustainable Development.
Are you interested to deepen your knowledge on composite indicators and scoreboards? Then join the JRC team in the Lake Maggiore area, Italy, from 4 to 8 November 2019 for the JRC Week on Composite Indicators and Scoreboards.
Contact: JRC-COIN@ec.europa.eu
About JRC
The Joint Research Centre (JRC) is the European Commission’s science and knowledge service. The JRC provides European Union and national authorities with solid facts and independent support to help tackle the big challenges facing our societies today. The JRC creates, manages and makes sense of knowledge, delivering the best scientific evidence and innovative tools for the policies that matter to citizens, businesses and governments. Twitter: @EU_ScienceHub